loki collection nginx logs
之前日志服务用的较多的一般是 ELK ,但是对于小规模的使用 elk 则显得太重了,于是尝试用 loki+Promtail+grafana 来实现。
这里的 Loki 类似 elasticsearch ,用于存储;Promtail 类似 Logstash 或者 Fluent,用于收集;Grafana 类似 Kibana,用于展示。
Loki 受到了 prometheus 启发,对日志进行打标签的方式而非全文索引的方,而且也可以跟 kubernetes 集成。
Like Prometheus, but for logs!
为了减少 Promtail 的额外配置,先把 nginx 日志改成 JSON 的方式输出。如果需要收集之前的日志,可以修改 Promtail 配置,自己添加正则解析。
nginx log 改为 JSON format
修改 Nginx 日志为 json 格式
log_format json_analysis escape=json '{'
                            '"msec": "$msec", ' # request unixtime in seconds with a milliseconds resolution
                            '"connection": "$connection", ' # connection serial number
                            '"connection_requests": "$connection_requests", ' # number of requests made in connection
                            '"pid": "$pid", ' # process pid
                            '"request_id": "$request_id", ' # the unique request id
                            '"request_length": "$request_length", ' # request length (including headers and body)
                            '"remote_addr": "$remote_addr", ' # client IP
                            '"remote_user": "$remote_user", ' # client HTTP username
                            '"remote_port": "$remote_port", ' # client port
                            '"time_local": "$time_local", '
                            '"time_iso8601": "$time_iso8601", ' # local time in the ISO 8601 standard format
                            '"request": "$request", ' # full path no arguments if the request
                            '"request_uri": "$request_uri", ' # full path and arguments if the request
                            '"args": "$args", ' # args
                            '"status": "$status", ' # response status code
                            '"body_bytes_sent": "$body_bytes_sent", ' # the number of body bytes exclude headers sent to a client
                            '"bytes_sent": "$bytes_sent", ' # the number of bytes sent to a client
                            '"http_referer": "$http_referer", ' # HTTP referer
                            '"http_user_agent": "$http_user_agent", ' # user agent
                            '"http_x_forwarded_for": "$http_x_forwarded_for", ' # http_x_forwarded_for
                            '"http_host": "$http_host", ' # the request Host: header
                            '"server_name": "$server_name", ' # the name of the vhost serving the request
                            '"request_time": "$request_time", ' # request processing time in seconds with msec resolution
                            '"upstream": "$upstream_addr", ' # upstream backend server for proxied requests
                            '"upstream_connect_time": "$upstream_connect_time", ' # upstream handshake time incl. TLS
                            '"upstream_header_time": "$upstream_header_time", ' # time spent receiving upstream headers
                            '"upstream_response_time": "$upstream_response_time", ' # time spend receiving upstream body
                            '"upstream_response_length": "$upstream_response_length", ' # upstream response length
                            '"upstream_cache_status": "$upstream_cache_status", ' # cache HIT/MISS where applicable
                            '"ssl_protocol": "$ssl_protocol", ' # TLS protocol
                            '"ssl_cipher": "$ssl_cipher", ' # TLS cipher
                            '"scheme": "$scheme", ' # http or https
                            '"request_method": "$request_method", ' # request method
                            '"server_protocol": "$server_protocol", ' # request protocol, like HTTP/1.1 or HTTP/2.0
                            '"pipe": "$pipe", ' # "p" if request was pipelined, "." otherwise
                            '"gzip_ratio": "$gzip_ratio", '
                            '"http_cf_ray": "$http_cf_ray"'
                            '}';

  access_log  /var/log/nginx/json_access.log json_analysis;
重启 nginx -s reload
Loki 部署
截止到发稿,当前最新的 Loki 版本是 2.6.1
准备 Loki 配置文件
# wget https://raw.githubusercontent.com/grafana/loki/v2.6.1/cmd/loki/loki-local-config.yaml -O /etc/loki/local-config.yaml
auth_enabled: false

server:
  http_listen_port: 3100
  grpc_listen_port: 9096

common:
  path_prefix: /data/loki
  storage:
    filesystem:
      # 指定存储的目录,可以在启动 Docker 时挂载出来,持久化保存在机器上
      chunks_directory: /data/loki/chunks
      rules_directory: /data/loki/rules
  replication_factor: 1
  ring:
    instance_addr: 127.0.0.1
    kvstore:
      store: inmemory

schema_config:
  configs:
    - from: 2020-10-24
      store: boltdb-shipper
      object_store: filesystem
      schema: v11
      index:
        prefix: index_
        period: 24h

ruler:
  alertmanager_url: http://localhost:9093

analytics:
  reporting_enabled: false
Docker 运行 Loki
docker run --name loki \
  -d \
  -v /etc/loki:/etc/loki \
  -v /data/loki:/data/loki \
  -p 3100:3100 \
  grafana/loki:2.6.1 \
  -config.file=/etc/loki/local-config.yaml
Promtail 部署
准备 Promtail 配置文件
# wget https://raw.githubusercontent.com/grafana/loki/v2.6.1/clients/cmd/promtail/promtail-docker-config.yaml -O /etc/promtail/config.yaml
server:
  http_listen_port: 9080
  grpc_listen_port: 0

positions:
  filename: /tmp/positions.yaml

clients:
  - url: http://loki:3100/loki/api/v1/push

scrape_configs:
  - job_name: nginx
    static_configs:
      - targets:
          - localhost
        labels:
          job: nginx_access_log
          __path__: /var/log/nginx/json_access.log
Docker 运行 Promtail
docker run --name promtail \
  -d \
  -v /etc/promtail:/etc/promtail \
  -v /var/log:/var/log \
  -v /usr/local/nginx/logs:/usr/local/nginx/logs \
  --link loki \
  grafana/promtail:2.6.1 \
  -config.file=/etc/promtail/config.yaml
Grafana 部署
Grafana 部署步骤这里忽略,可以参考前面的博文。
在 Grafana 数据源里添加 Loki 数据源,配置 URL 为:http://localhost:3100/ 即可。如果 Loki 是用 Docker 启动的,需要先查看下 Loki 的 IP,然后把 localhost 改为 Loki IP 即可。
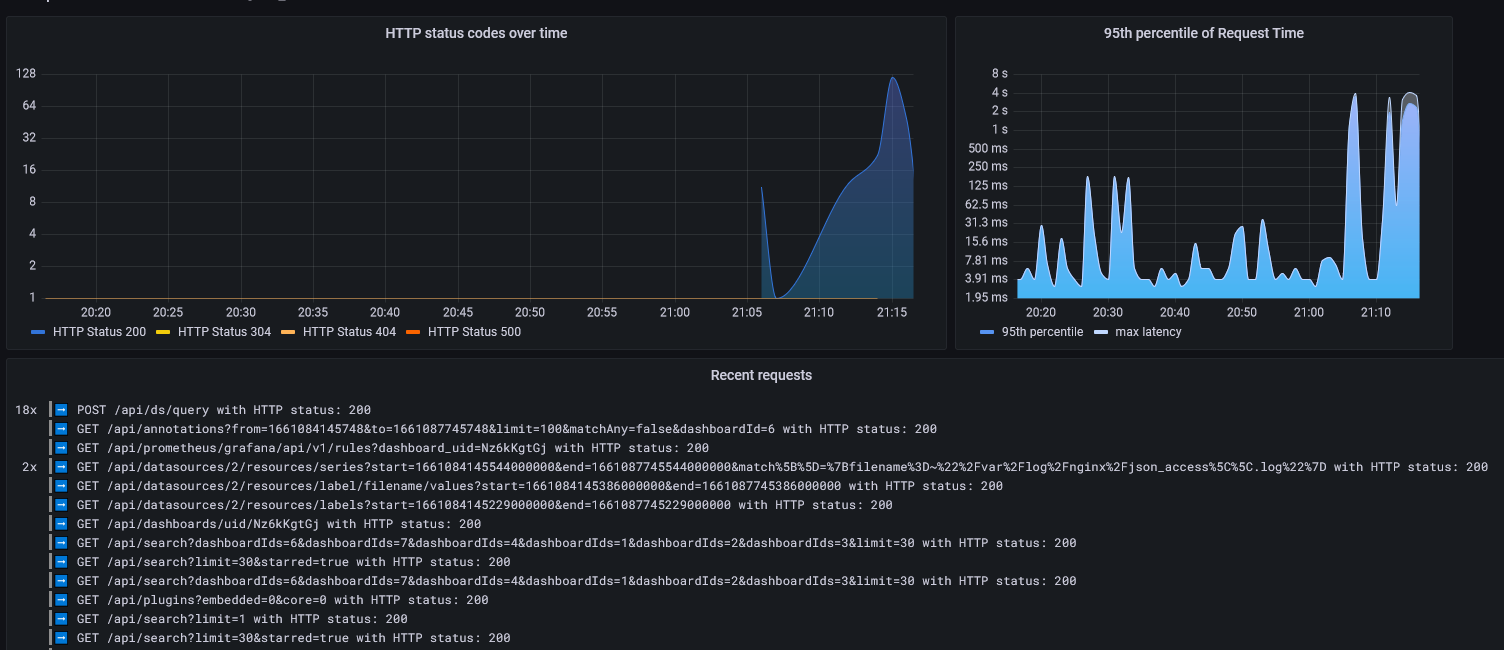
常用 Dashboard:12559
其他
ELK 是一套针对日志数据做解决方案的框架,分别代表了三款产品:
- E: ElasticSearch(ES),负责日志的存储和检索;
- L:Logstash,负责日志的收集,过滤和格式化;(因为 Logstash 占用资源较多,后续又出现了 Fluent, Fluent-bit 等 C 写的更低资源占用,更高性能的替代品,也就是 EFK 方案里的 F)
- K:Kibana,负责日志的展示统计和数据可视化;